
When a single application relies on multiple services, servers, databases, networks, and cloud environments, finding the source of a problem is rarely as simple as checking whether a server is down.
An application issue can start with the network, surface as an error in the application code, and eventually appear as a failed transaction on the user side. At the same time, each layer may have its own monitoring tools and data. Without a way to connect these signals, IT teams can spend more time piecing together what happened than fixing the problem.
This is where Bonree ONE, an integrated intelligent observability platform from Bonree Data, comes in. The platform brings monitoring across different IT layers into one environment, covering users, applications, infrastructure, networks, and business operations. It also uses AI capabilities to help teams detect anomalies, identify trends, manage alerts, and investigate potential root causes.
What Can Be Done with Bonree ONE?
One of the challenges with traditional monitoring is that each layer is often viewed separately. Network teams focus on network metrics, infrastructure teams monitor servers, and application teams look at application performance. Yet the issue experienced by a user can involve several of these layers at once.
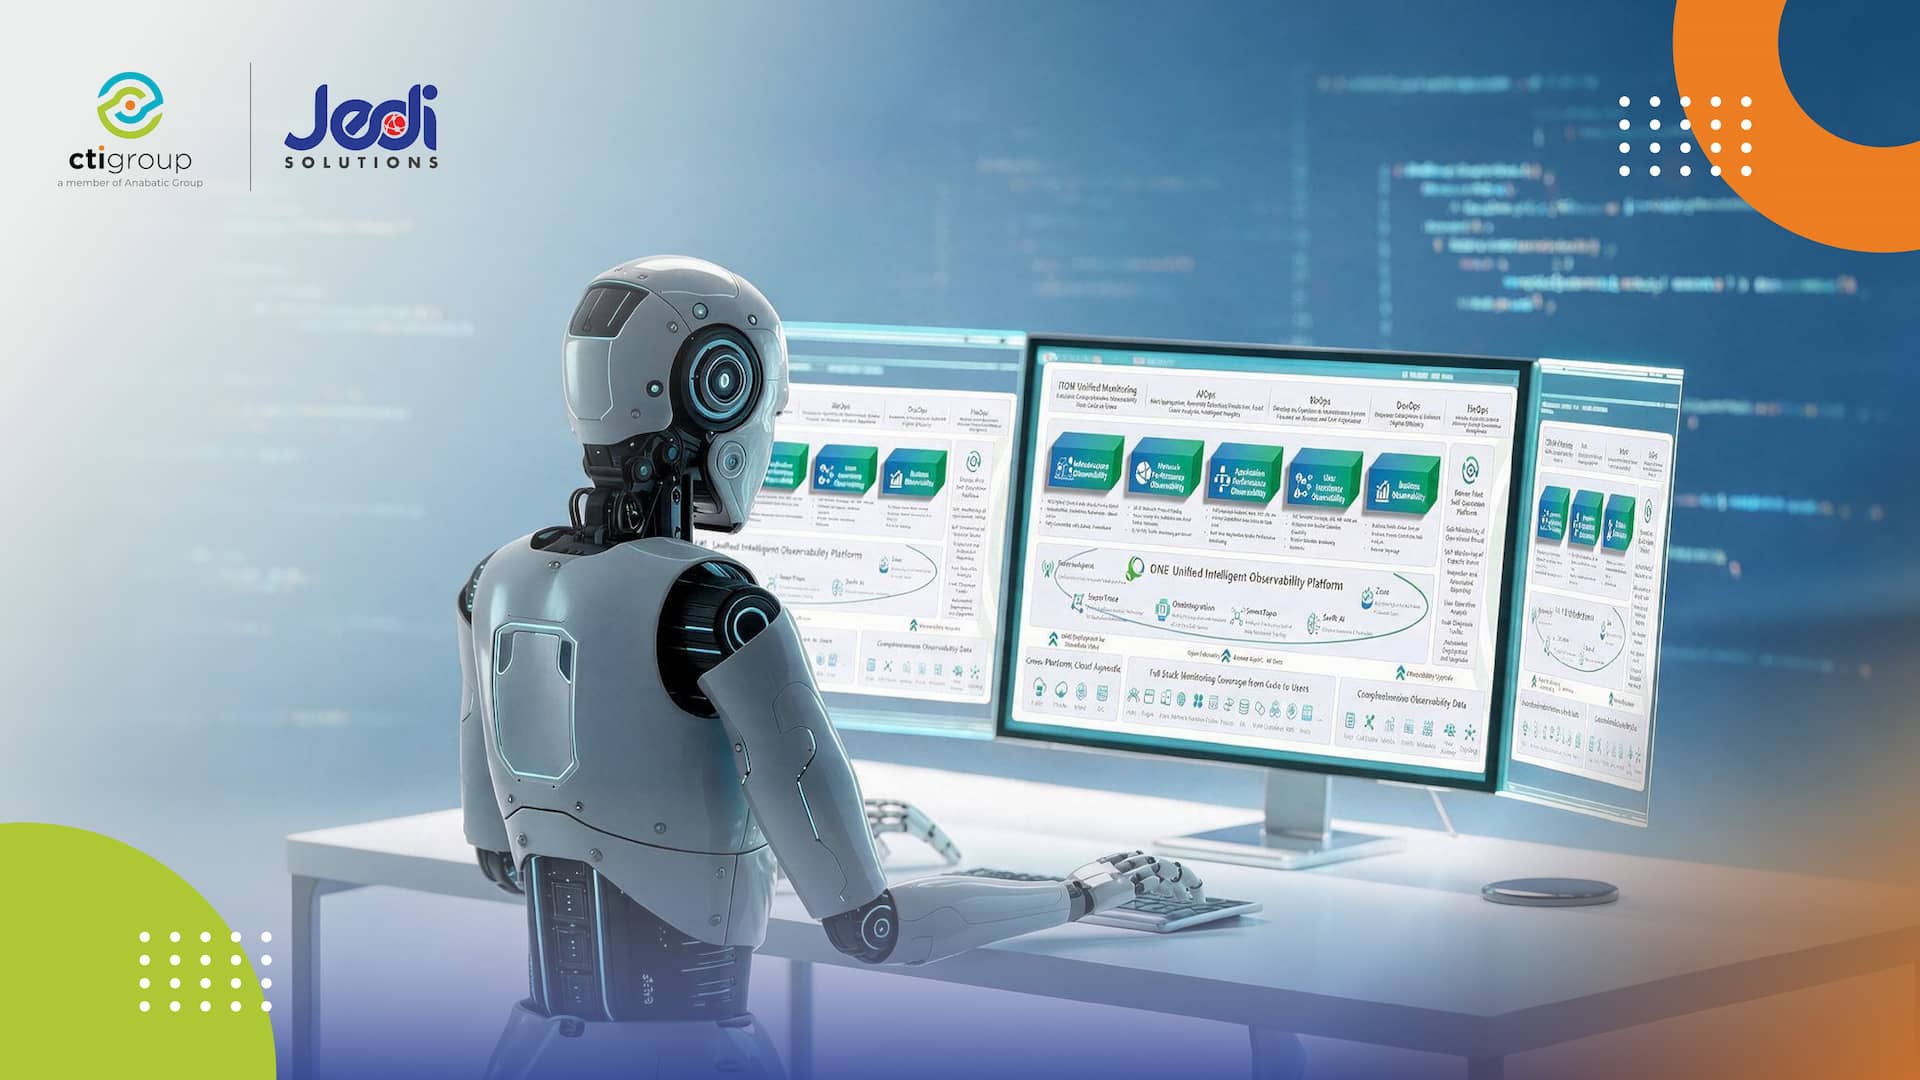
Bonree ONE addresses this through five areas of observability designed to give teams a broader view of their IT environment.
Business Observability
IT performance ultimately affects business activity. Failed transactions or slow processes, for example, can have a direct impact on business performance. Through business observability, Bonree ONE connects technical metrics with business indicators such as business performance scores, transaction success rates, and conversion rates.
The platform can also generate alerts when anomalies appear in business metrics and support root cause analysis. This gives IT and business teams a way to understand system conditions in the context of their potential business impact.
User Experience Observability
From a user’s perspective, it is not enough for an application to simply be available. How quickly and consistently it performs also matters.
Bonree ONE combines Synthetic Testing and Real User Monitoring (RUM) to collect performance data as users interact with applications. The data can be used to compare user experiences across different regions and networks. This helps teams determine whether a performance issue is widespread or limited to a particular location or network condition.
Application Performance Observability
When an application starts experiencing problems, the next question is usually where the problem comes from.
Application performance observability provides visibility into application performance through monitoring, logging, analysis, and application-level code diagnostics. Bonree ONE supports application environments including Java, .NET, and PHP.
The platform also provides application transaction tracing, allowing teams to follow transactions from the user interface through backend servers and database servers. This makes it easier to narrow down where a problem may occur without having to investigate every component separately.
Infrastructure Observability
Applications also depend on the infrastructure running behind them. In enterprise environments, that infrastructure may span on-premises systems and multiple cloud models.
Bonree ONE supports IDC (on premises), hybrid cloud, public cloud, and private cloud environments. Its unified monitoring framework collects and analyzes performance metrics from operating systems, containers, and cloud resources. The resulting data can be visualized within a single monitoring environment, giving teams a clearer view of infrastructure performance.
Network Performance Observability
Network performance is another important part of the application delivery chain. High latency, packet loss, or heavy bandwidth utilization can affect application performance even when the application and server themselves appear healthy.
Bonree ONE uses L2–L7 network protocol analysis to examine network traffic and performance in greater detail. The platform also supports network auto-discovery and topology visualization. Key metrics such as latency, packet loss, and bandwidth utilization can be monitored in real time, giving teams additional context when troubleshooting network-related issues.
How Does Bonree ONE Connect Observability Data?
Collecting data from different IT layers is only part of the challenge. The next step is making sense of that data, finding unusual patterns, understanding what changed, and narrowing down potential causes.
Bonree ONE supports this process through several components, covering everything from data collection to intelligent analysis.
Data Collection Layer
The Data Collection Layer gathers information from different parts of the IT environment.
- BonreeAgent is a lightweight data collector designed for deployment across different IT environments.
- SuperTrace supports data collection and processing for distributed tracing.
- OneIntegration connects Bonree ONE with third-party systems and supports unified data collection.
The collected data then becomes the foundation for analysis within the platform.
Intelligent Analysis Engine
Once observability data is available, the next challenge is turning it into useful information for day-to-day operations.
Bonree ONE provides several intelligent analysis capabilities to help teams identify anomalies, understand trends, manage alerts, and investigate potential root causes.
Swift AI
Swift AI is Bonree’s AI algorithm engine, covering capabilities such as anomaly detection, trend prediction, alert convergence, root cause analysis, and LLM-based agents for IT operations.
Anomaly Detection: Swift AI analyzes time-series data in real time and generates dynamic baselines based on specific conditions. This capability can be applied to different types of metrics, from CPU, memory, and disk utilization to application metrics such as transaction volume, response time, and success rate.
The platform uses several approaches for identifying unusual patterns, including statistical methods, machine learning, and deep learning techniques such as autoencoders and variational autoencoders.
Trend Prediction: Monitoring tells teams what is happening now, but historical data can also provide clues about what may happen next.
Swift AI can be used to predict trends in operational metrics. For example, certain patterns may indicate potential equipment or system issues, giving teams an opportunity to prepare maintenance activities earlier. Resource utilization trends can also support capacity planning and help organizations anticipate future resource requirements. Some of its key capabilities include:
Alert Convergence: In an environment with many interconnected components, a single incident can trigger multiple alerts across different systems. Treating every alert as a separate issue can make it difficult for teams to identify what needs attention.
Alert convergence groups related to alerts to reduce alert noise. By bringing related notifications together, teams can get a more focused view of an incident and use it as a starting point for further investigation.
Root Cause Analysis: Once an anomaly has been identified, teams still need to determine what caused it. Swift AI supports root cause analysis through several approaches, including:
- Rule-based methods, using predefined rules and thresholds.
- Statistical analysis-based methods, analyzing metrics, transactions, trends, and periodic patterns.
- Machine learning-based methods, using AI models to analyze historical failure data.
- Knowledge graph-based methods, mapping relationships between symptoms, and potential causes.
Together, these methods can help narrow down potential sources of a problem and support faster investigation.
LLM Agents
Swift AI also includes two LLM-based agents designed to support day-to-day IT operations.
Knowledge Q&A Agent with Xiaorui Assistant: Xiaorui Assistant can help explain Bonree ONE features, assess the current state of the IT environment, and assist users in creating PromQL expressions.
Root Cause Analysis Agent: This agent analyzes observable signals associated with alerts and uses a knowledge base to help identify potential sources of a problem. It then provides conclusions around possible root causes that teams can use as part of their investigation.
SmartTopo
When an IT environment contains many interconnected components, understanding those relationships can be just as important as monitoring the components themselves.
SmartTopo uses auto-discovery to identify and visualize system topology. The capability is supported by Bonree’s universal observability data model, which connects different types of information, including entities, relationships, metrics, logs, traces, events, and metadata.
By organizing these signals within a common model, teams can correlate information across components and better understand how different parts of the IT environment are connected.
OneData
All this observability data also needs a consistent way to be stored and processed. OneData is Bonree’s unified data platform, supporting multimodal data while combining data lake and data warehouse capabilities. Metrics, logs, traces, and events can be stored within a unified observability data model.
Because these signals share the same model, they can be correlated when teams perform queries and analysis across different observability scenarios.
What Are the Key Advantages of Bonree ONE?
Bonree ONE brings together several capabilities that support observability across different technologies and IT environments.
Its key advantages include:
- Cross-Platform & Cloud-Agnostic: supports different technology stacks and cloud environments.
- Full Monitoring Stack Coverage: covers monitoring from code level through to the user.
- Comprehensive Observability Data: brings together different types of observability data, including metrics, logs, and traces.
This broad coverage allows teams to monitor different parts of the IT environment without limiting observability to a single layer.
Bonree ONE for Different IT Operations Use Cases
The capabilities within Bonree ONE can support different operational needs, from infrastructure monitoring to application development.
ITOM Integrated Monitoring
Bonree ONE can be used to build monitoring across the technology stack, from users to application code. Data from different layers can then be managed and analyzed within a unified platform.
AIOps Intelligent Operations
Its AI capabilities support AIOps use cases through alert convergence, anomaly detection, trend prediction, root cause analysis, and intelligent insights.
Continuous Monitoring and Optimization
Monitoring can extend across the software development lifecycle (SDLC), from development and testing through to production. Performance data can then support ongoing application monitoring and optimization.
Security and Performance Fusion
Application security and performance can be viewed within the same environment. Bonree ONE combines application security monitoring with performance monitoring to give teams a more connected view of both areas.
DevOps Support
Performance data from development environments, tools, and processes can support DevOps practices and provide greater visibility into applications throughout the development process.
Bringing Observability Closer to IT Operations
As IT environments grow more distributed, having more monitoring tools does not necessarily make troubleshooting easier. The bigger challenge is connecting the data from those tools and understanding what it means in context.
Bonree ONE brings together user experience, application, infrastructure, network, and business observability within a single platform. Data from these different sources can then be analyzed through capabilities such as anomaly detection, trend prediction, alert convergence, and root cause analysis.
For organizations looking to modernize their IT operations, this integrated approach can provide a more connected view of system health, from how infrastructure performs to how applications are experienced by users and how those systems support the business.
Want to learn more about Bonree ONE? Learn about Bonree’s solutions through Jedi Solutions by clicking the link below.
Author: Mochammad Taufik – Technical Manager Jedi Solutions
Editor: Wilsa Azmalia Putri – Content Writer CTI Group
